Last month, EFA Committee Chair Erich Schnitzler and I attended the Wolfe Research Global Transportation & Industrials Conference in New York City. Wolfe Research is one of the premier equity research firms on Wall Street. I was invited to speak on a three-Pilot labor panel that focused on industry profitability, changes in the business at Southwest, Pilot contracts, safety, and ATC. The other two panel participants were ALPA National President Jason Ambrosi and APA President Nick Silva. In the audience were Tom Doxey, SWA CFO; Tony Roach, SWA EVP Customer & Brand; and Julia Landrum, SWA VP Investor Relations. Tom Doxey’s Southwest Airlines presentation immediately followed our panel. I greatly appreciated the Southwest executive team in attendance coming to hear what we had to say about the Pilot profession and our thoughts on the business. I also liked Tom’s positive energy in articulately presenting the plan to move Southwest forward. We are business partners with Southwest and won’t have long-term career success unless the Company succeeds, so in other words, we are in this together and dependent upon strong leadership coming from the C-suite.
As Pilots, we need Southwest Airlines to start driving additional revenue for the financial health of the business, take costs out where it makes sense (i.e., previously announced elimination of fuel hedging, lower procurement costs, etc.), increase our profit sharing, and provide a path for future growth – especially on the international front. The current plan is a great first step and is designed to achieve these objectives. We look forward to hearing more planned initiatives in our transformation as we can’t afford to stop evolving. Investor Concerns Pilot pay has essentially just kept pace with inflation over the past 30 years. However, Boeing and Airbus have continued extending narrowbody fuselages. As a result, Pilots are much more productive in terms of seats flown per trip (seat gauge) versus 30 years ago. In 2018 when I was on the EFA Committee, myself, Erich Schnitzler, and Greg Auld did a study on Pilot pay, supply, and a look ahead to the next Contract cycle. I presented the study at the J.P. Morgan Global Transportation Conference that same year to better explain these issues to investors.
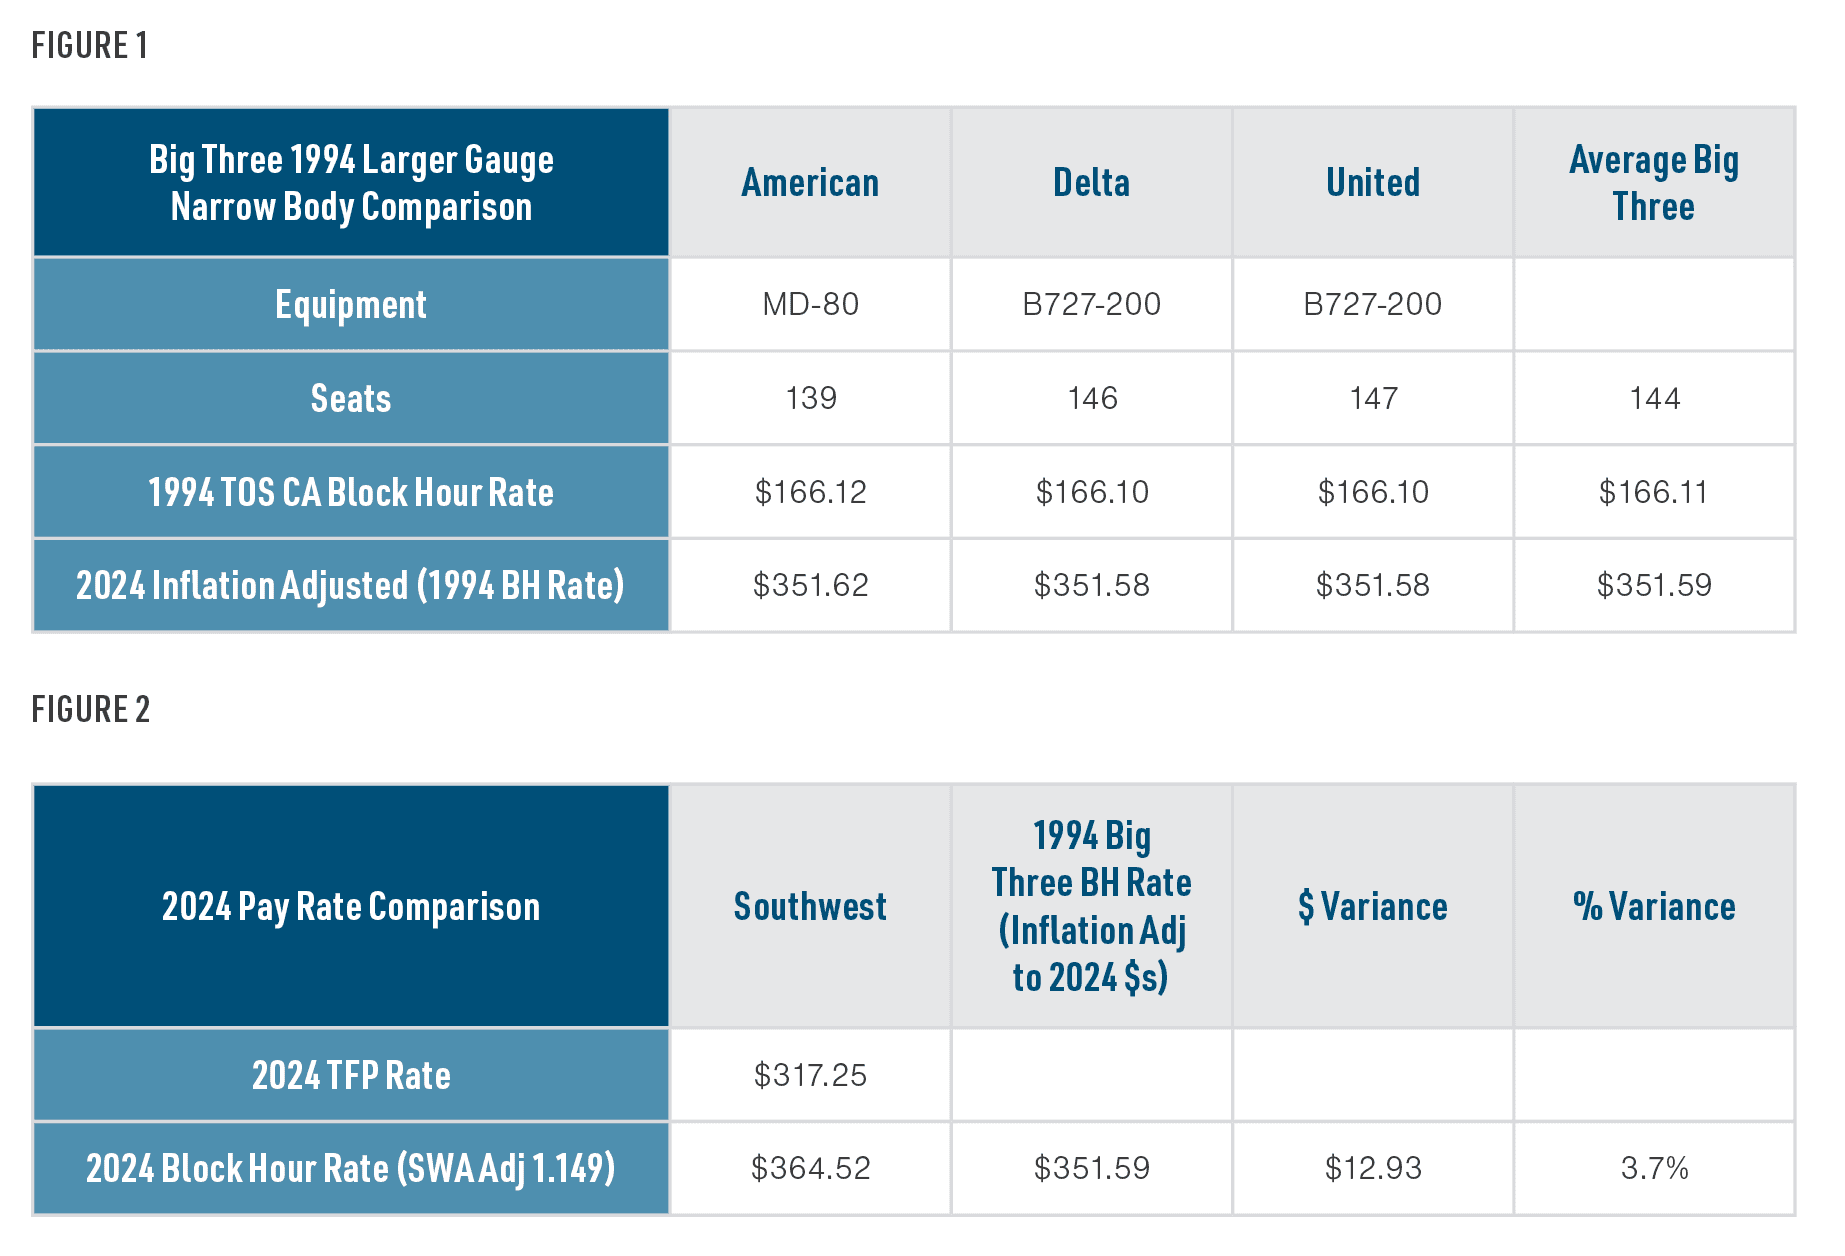
In writing this article, I “blew the dust off” our 2018 study to see where our Pilots are today in terms of pay and productivity. As shown in Figure 1, in 1994, the “larger gauge” narrowbodies used in our study at the Big Three were the MD-80 with 139 seats (AAL) and the 727-200 with 146-147 seats (DAL/UAL). The average Top-of-Scale (TOS) CA pay rate at the Big Three in 1994 for these aircraft was $166.11 per hour. Fast-forward to 2024, 30 years later, and the Southwest TOS CA 737 block hour adjusted (1.149 TFPs to block hour (BH)) rate was $364.52 per hour. The $364.52 (2024) rate sits just 3.7% above the 1994 inflation adjusted Big Three rate of $351.59 ($166.11 adjusted to 2024 dollars) as shown in Figure 2. As stated above, Pilot pay has essentially just kept pace with inflation over the past 30 years with no appreciable rate gains in “real dollar” terms.
Pilot Pay & Productivity – A 30-Year Perspective One obvious concern on investors’ minds is higher labor costs and their perceived negative impact upon airline profitability and margins as a result of revenues that have failed to keep pace with rising costs. Specifically, the one area that draws the most investor attention is Pilot pay from the most recent cycle. In this month’s article, I will drill down into Pilot pay – why our pay rates are justified, the industry, and structural changes that need to take place.
As I explained to investors, higher labor and other cost increases are analogous to an oil spike. Industry response is higher fares and other revenue streams to protect margins. The problem is the supply of domestic seats (capacity) must be adjusted downward as prices move higher due to the price elasticity of demand. Southwest has grown capacity by 12.7% from 2019 through 2024. However, Southwest’s unit revenue was up only 8.8% over the same period while core unit costs, or CASM-ex (CASM excluding fuel, special items, and profit sharing) were up 30%. The increased domestic capacity across the industry is partially responsible for insufficient unit revenue gains. For higher prices to hold, supply has to come out as domestic capacity is rationalized. The consumer with lower discretionary income is priced out at higher prices as they will purchase gas and groceries before airline tickets. These consumers are very price sensitive and have been hurt the most by inflation. Both the ULCCs and LCCs compete for these customers and have seen significant margin destruction. Consumers with higher discretionary income want to spend their dollars on travel experiences.
The demand for premium seating and long-haul international itineraries has exploded, both items which ULCCs and LCCs don’t typically offer. As mentioned above, Southwest’s unit revenue was only up 8% from 2019 through 2024, while Delta’s was up 16% over the same period, nearly doubling the Southwest performance. Structural Change Airlines will reduce capacity on their own – driven by market forces. Possible competitor bankruptcies (Spirit already filed/emerged) Partnerships (UAL/JBLU announced) M&A activity (ALK/HA) SWAPA Pilots are looking for Southwest to restore the business to producing historic levels of profitability and margins. Revenues need to increase to cover higher costs. Southwest’s key advantages are strength of balance sheet and domestic network strength. With the largest domestic network of any airline, Southwest is No. 1 in 23 of the top 50 origination and destination markets in the United States. Our Pilots are looking for Southwest to connect that network with more short-haul and add long-haul international destinations. We also want Southwest to create onboard and airport experiences that consumers value.
I am encouraged by the announced changes at Southwest and their revenue-producing potential. More change is needed, and we must remain nimble in the highly competitive airline industry. In closing, Pilots at the Big Four have received raises that have essentially kept pace with inflation over the past 30 years. As a group we are more productive on a trip basis as narrowbody fleets have experienced an increase in seat gauge. To maintain an adequate supply of Pilots, the industry needs to continue to provide a strong compensation package for Pilots to attract the best and brightest into the profession. As Pilots, we are the on-site risk managers, ensuring the safety of the traveling public on every flight, every day. Professional Pilot wages are not responsible for reduced profitability and margins at airlines, they are a cost of doing business and are here to stay.
Conclusion Southwest has said they will grow capacity by 1%-2% this year. The airline industry can typically sustain capacity growth of one-to-two times real GDP growth to meet demand, and GDP is expected to grow slightly above 1% in 2025. As a result, Southwest’s muted capacity growth for 2025 is right on target. The market will eventually drive excess domestic capacity out in a variety of ways: The winners in the airline industry in today’s higher cost environment are carriers that have numerous revenue levers to pull and cater to all consumers, not just one segment, with a full suite of premium offerings and global networks. The market will drive excess domestic capacity out as there will be winners and losers in the airline industry. Using my previous oil spike analogy, fares will eventually rise to cover higher costs as capacity adjusts and the carriers with the right business plan will be successful in this higher cost environment.
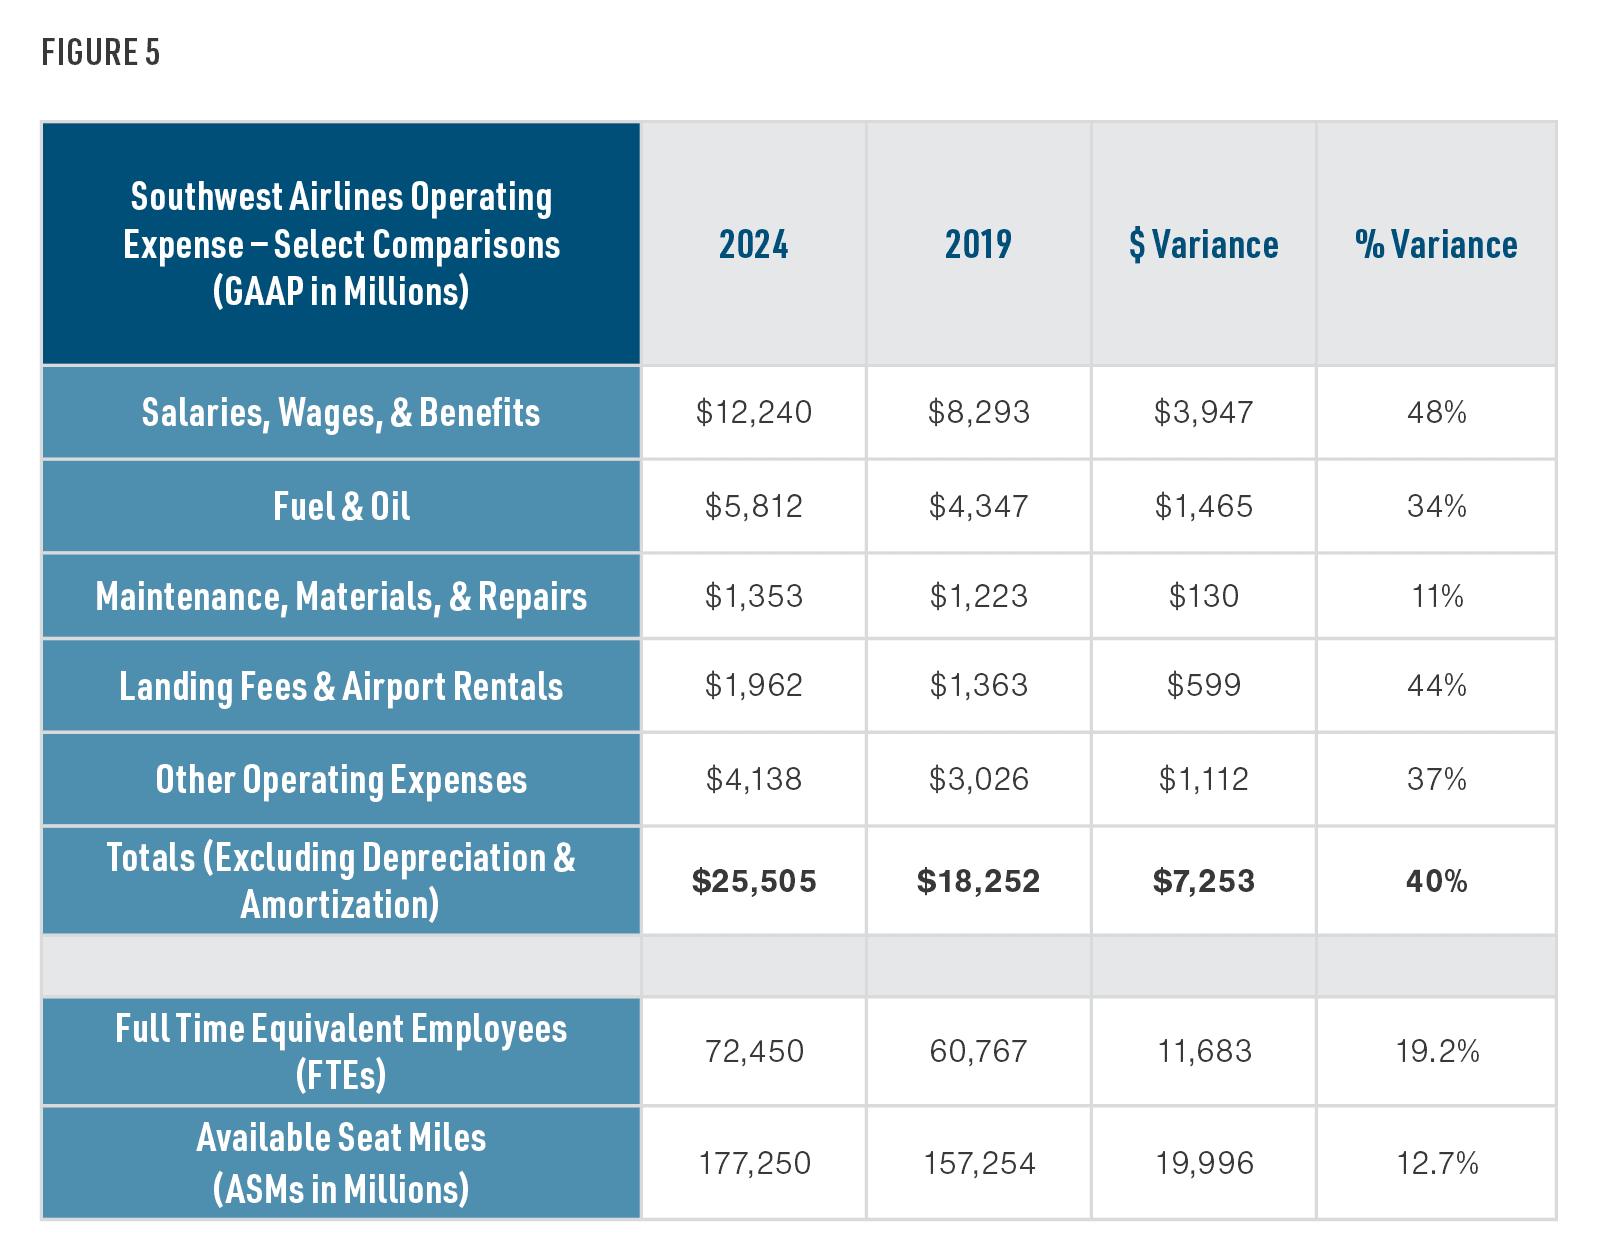
Higher Costs Are Here to Stay – Solutions Are Higher Revenue & Reduced Capacity SW&B is the highest category at 48%. However, you need to consider more employees were added post meltdown and in advance of Boeing deliveries that never arrived. The evidence is in FTEs up 19.2% versus capacity (ASMs) up only 12.7%. This added headcount, which exceeds the capacity increase, has added to SW&B expenses. The Company unfortunately had to eliminate 1,750 corporate jobs, which will generate $300 million in cost savings in 2026. Other areas that have seen significant increases are fuel and oil (+34%), landing fees and airport rentals (+44%), and other operating expenses (+37%). All these areas are up significantly, primarily because of inflation experienced throughout the economy coming out of the pandemic, but also due partly to the 12.7% capacity growth. Depreciation and amortization were not included in this analysis as these are non-cash items. Are cost increases at Southwest Airlines only being experienced in Salaries, Wages and Benefits (SW&B)? The answer is no, they are being seen across the board as shown in Figure 5 with a comparison of full year 2024 versus 2019, the year before the pandemic.
Cost Increases Broken Down A Southwest Pilot is much more productive today than 30 years ago when measured in seats flown per trip – the airplanes are bigger. To bring it home, today’s Southwest Airlines Pilots are essentially paid the same in inflation adjusted terms as their Big Three counterparts from 30 years ago while flying aircraft with many additional seats. These added seats produce more available seat miles (ASMs), which are the revenue producing “widgets” of the airline industry. The additional ASMs help dampen Pilot unit cost increases in nominal terms and the larger aircraft result in lower fuel burns per ASM.
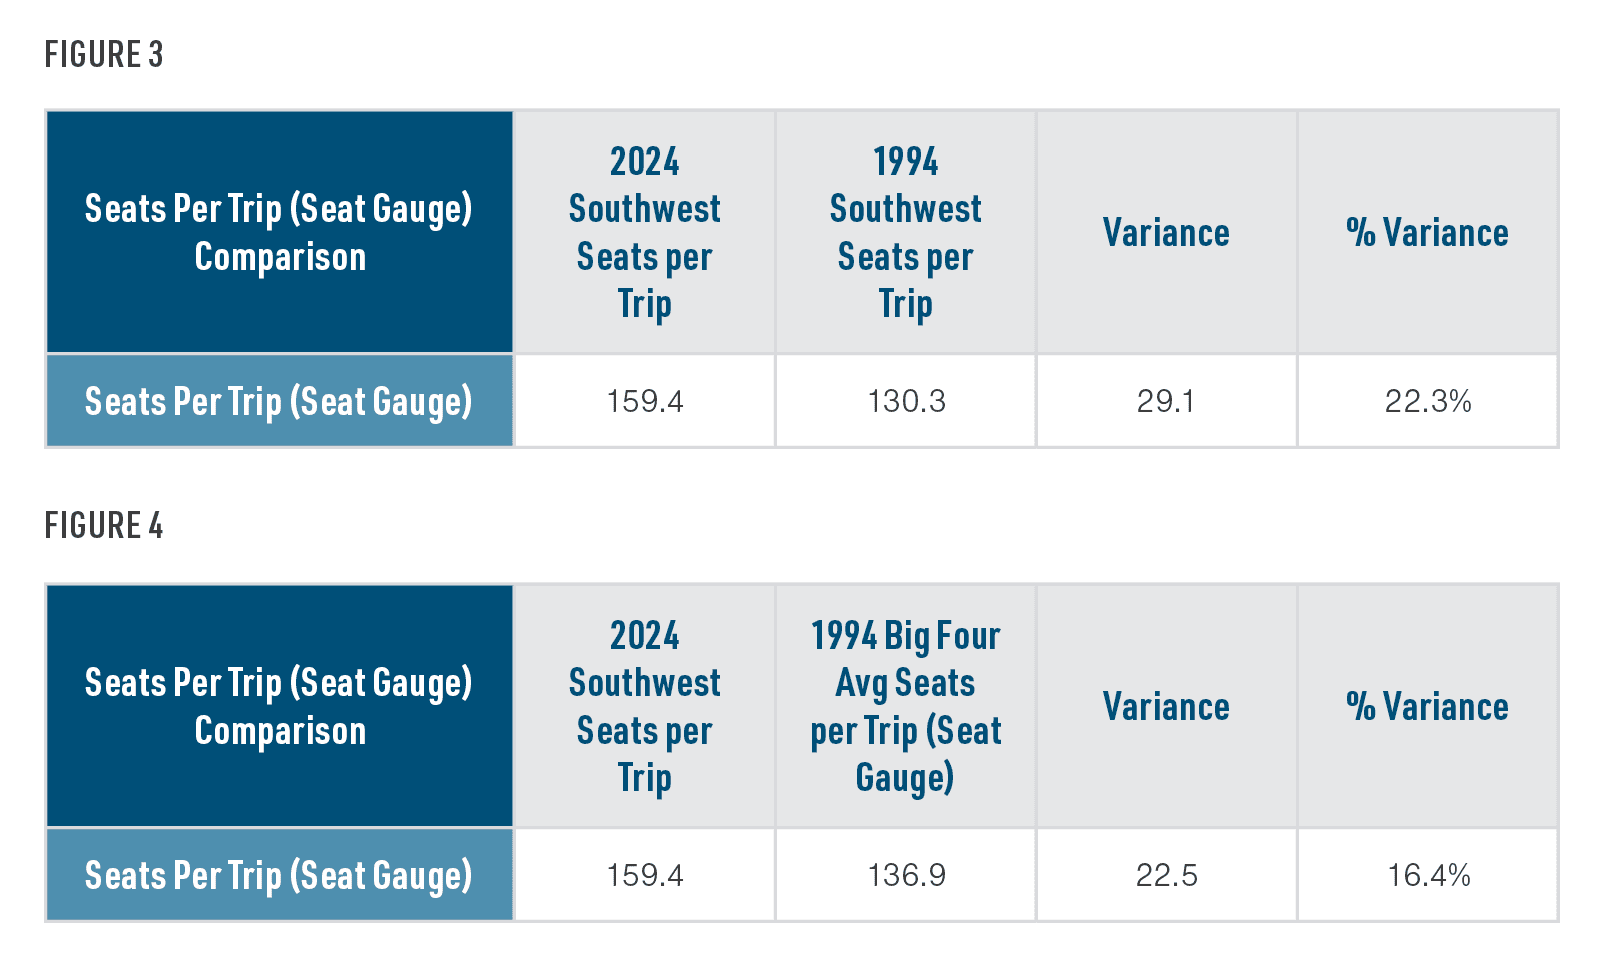
Next, our 2018 study also looked at Pilot productivity in terms of seats flown per trip (seat gauge). In 1994, Southwest Pilots flew an average of 130.3 seats per trip versus 159.4 in 2024 (see Figure 3). That is an increase of 22.3% in additional seats per trip over the 30-year period. Average seats per trip at the Big Four (including the 757-200 domestic) in 1994 was 136.9 seats (see Figure 4). When comparing the 1994 Big Four average seats per trip of 136.9 to the 159.4 seats per trip a Southwest Pilot flew in 2024, it still represents an increase of 16.4% over the period.
Charts